Allen Brain Observatory: Visual Coding
The Allen Brain Observatory presents its inaugural dataset, allowing for quantitative exploration of the functional
properties that underlie coding of sensory stimuli through the visual pathway, at both the single-cell and
population levels. The characterization of visually evoked cellular responses is carried out using in vivo
calcium imaging from GCaMP6-expressing neurons measured from selected brain areas, cortical layers, and Cre lines.
The cellular responses acquired during the presentation of the drifting grating stimulus provide data to help
characterize visual tuning properties of cells, such as orientation tuning (a preference for a grating orientation),
direction preference, and temporal frequency tuning (a preference for a specific temporal frequency).
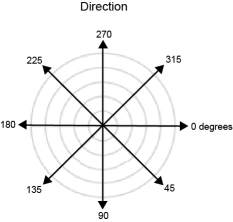
Visual Stimulus: Drifting Gratings
The drifting grating stimulus consists of a full-field sinusoidal grating that drifts in a direction perpendicular
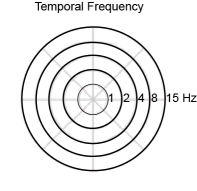
to the orientation of the grating. In this experiment, the grating drifts in one of eight directions, at 45°
intervals, and at one of five temporal frequencies, ranging from 1 to 15 cycles per second, resulting in 40 distinct
grating conditions. The presentation of the visual stimulus is as follows; a grating condition is presented for 2
seconds, and is followed by 1 second of mean luminance gray before the next grating condition is presented. Each of
the 40 grating conditions is repeated 15 times, in a random order, and there are intermittent blank sweeps
throughout the stimulus (i.e. the 2 second grating condition is replaced with 2 seconds of mean luminance gray).
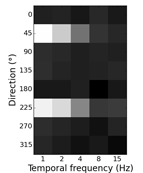
Evaluating cellular responses to the Drifting Grating visual stimulus
By comparing the responses to each of the 40 grating conditions, as measured by an increase in fluorescence due to
increased calcium concentration, visual tuning properties such as orientation tuning, direction preference, and
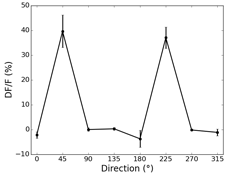
temporal frequency tuning are evaluated. Typically, the orientation tuning would be represented by plotting the mean
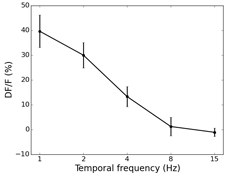
response (from 15 trials) to all eight directions at the preferred temporal frequency, while the temporal frequency
tuning would be represented by plotting the mean response to all five temporal frequency conditions at the preferred
grating direction.
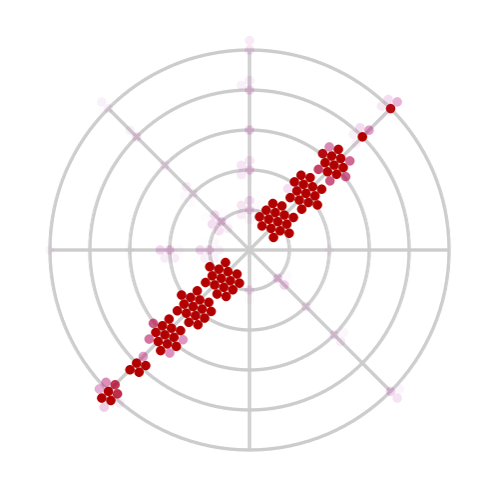
Evaluating cellular responses to the Drifting Grating visual stimulus: Simplifying Data Display
To simplify data visualization, the cellular response to the drifting grating stimulus is represented using the "Star"
plot. Each arm of this figure represents a grating drift direction, while each ring represents the temporal frequency
of the grating. At each intersection, the responses from 15 trials are ranked, and represented as a single
red dot, the intensity of which corresponds to the strength of the response.
Parsing data from many experimental trials
With this visualization, the orientation or direction tuning of a cell within a visual field can be quickly
evaluated. Likewise, the temporal frequency tuning can be evaluated by comparing the responses along one axis.
Further, by comparing the fifteen trials across a given visual stimulus, trial-to-trial variability can be assessed.
Hover your mouse over the Star plot to see the stimulus