Allen Brain Observatory: Visual Coding
The Allen Brain Observatory presents its inaugural dataset, allowing for quantitative exploration of the functional
properties that underlie coding of sensory stimuli through the visual pathway, at both the single-cell and
population levels. The characterization of visually evoked cellular responses is carried out using in vivo
calcium imaging from GCaMP6-expressing neurons measured from selected brain areas, cortical layers, and Cre lines.
The cellular responses acquired during the presentation of the Locally Sparse Noise stimulus provide data to help
characterize visual tuning properties of cells, such as definition of the spatial receptive field, including both On
and Off subunits.
Visual Stimulus: Locally Sparse Noise
Conventionally, the spatial dimensions of the receptive field have been measured with a sparse noise stimulus, which
consists of a mean luminance gray display with a single white or black spot presented briefly in different locations.
This stimulus allows the visual field to be fully sampled with both light (On) and dark (Off) stimuli to map the
extent of the cells' receptive fields. Complete sampling of all positions in the visual field can require hours of
visual stimulus data collection.
Sparse noise
White spot is "On" stimulus, black spot is "Off" stimulus
White spot is "On" stimulus, black spot is "Off" stimulus
To examine the spatial extent of the receptive fields in an efficient manner, a "Locally Sparse Noise" stimulus was developed. In this display, multiple black and white spots are presented in each stimulus frame (250 ms each). Each spot is 4.65 on a side, and is surrounded by a spatial exclusion zone of 23 that is not occupied by any other spot. To better map receptive fields in higher visual areas, we also present a stimulus that has larger 9.3 spots, and a 46.5 degree exclusions zone, in experiments released in June 2017. Please note that the NWB files and Allen SDK refer to these two stimuli as Locally Sparse Noise 4 deg and Locally Sparse Noise 8 deg respectively.
Locally sparse noise
Evaluating cellular responses to the Locally Sparse Noise visual stimulus
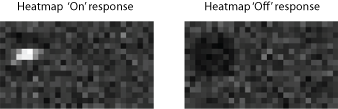
To map the receptive field structure, the cellular response is averaged over all trials (~115 trials) when a given
location is occupied by a spot, (i.e., a white spot). While there were other spots present in the stimulus for this
particular trial, the arrangement of these spots was always different, such that the effect of the other spots on a
cell's response should average away. A heatmap of a cell's On responses is created by looking at these average
responses for each location in the visual field. Similarly, a heatmap of the cell's Off responses can be created by
looking at the responses for the black spots across all locations.
Visualizing spatial receptive fields
The spatial receptive field for each cell is represented by two plots, showing the locations where the cell responded to white pixels (On) and black pixels (Off). For both On and Off, the mask of responsive pixels, created using a p-value map with multiple comparison correction, is applied to the stimulus average of responsive trials. The result is that only responsive pixels are shown, the strength of their response being indicated by the darkness of the color (red for On, blue for Off). This visualization captures the structure of On and Off subunits in the cell's spatial receptive field.
Receptive field "On"

Receptive field "Off"

Visualizing response variability
Consistent with the other visualizations in the Allen Brain Observatory, a figure highlighting the trial-to-trial
variability of the responses to this stimulus, or the "Pincushion" plot, was created. For each location in visual
space, all of the trials for an On stimulus are ranked and represented as dots, whose red hue corresponds to the
strength of that trial. The same is done for the off stimulus in blue plots. This visualization not only shows the
locations of strong responses to the On and Off stimuli (e.g. the On and Off subunits), but also reveals where the
presence of the On or Off stimulus causes a suppression of activity, evidenced by a smaller number of red or blue dots
than in surrounding areas.
"On" pincushion plot

"Off" pincushion plot
