Allen Brain Observatory: Visual Coding
The Allen Brain Observatory presents its inaugural dataset, allowing for quantitative exploration of the functional
properties that underlie coding of sensory stimuli through the visual pathway, at both the single-cell and
population levels. The characterization of visually evoked cellular responses is carried out using in vivo
calcium imaging from GCaMP6-expressing neurons measured from selected brain areas, cortical layers, and Cre lines.
The cellular responses acquired during the presentation of the static grating stimulus provide data to help
characterize visual tuning properties of cells, such as the spatial frequency tuning and the orientation tuning of
the cells, providing a finer measurement of orientation than provided from the drifting grating stimulus.
Visual Stimulus: Static Gratings
The static grating stimulus consists of a full field sinusoidal grating, that varies in orientation (the angle of
the grating), spatial frequency (the width of the grating), and phase (the position of the grating). In this
dataset, 6 orientations (at 30° intervals), 5 spatial frequencies (0.02 — 0.32 cycles/°), and 4 phases are
used
resulting in a total of 120 stimulus conditions. Each grating is presented briefly (250 ms) before being replaced
with a different orientation, spatial frequency and phase condition. Each condition is presented 50 times, in random
order, with intermittent blank sweeps.
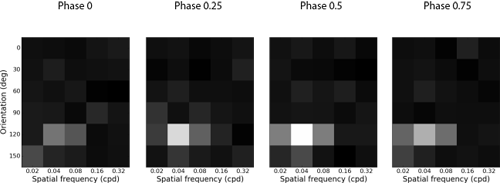
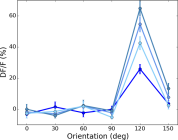
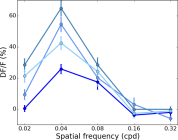
Evaluating cellular responses to the Static Grating visual stimulus
Capturing the responses to all 120 static grating conditions has up to this point required several figures.
Two-dimensional heatmaps can capture the orientation and spatial frequency tuning for each phase. Alternately, the
spatial frequency tuning can be plotted at the preferred orientation for each phase, or reciprocally, the
orientation tuning can be plotted at the preferred spatial frequency, also at each phase.
Evaluating cellular responses to the Static Grating visual stimulus: Simplifying data display
To capture the cellular responses of all these conditions in a single figure, the cellular responses to each static
grating are being represented using the "Fan" plot. Each arm represents the orientation of the grating, while each
arc represents a spatial frequency with the lowest frequency near the center of the plot and higher frequencies
radiating outward. At the intersections of these axes are four lobes, each corresponding to a different phase. Each
dot represents the response to a single trial of that grating condition, the color and intensity corresponding to
the strength of the response. In this way, the rank-ordered dots capture both the strength and the trial-to-trial
variability of the cells response to each condition.
Hover your mouse over the Fan plot to see the stimulus